Retail asset quality pressure will persist in the Asia Pacific region, due to slower economic growth and worse employment situations. However, the downside risk to banks’ retail asset quality will remain manageable, as regulators and banks continue their efforts to better manage credit risk.
October 20, 2017 | Wendy Weng- Slower economic growth and worse employment situations have led to higher retail non-performing loan (NPL) ratios in Asia Pacific
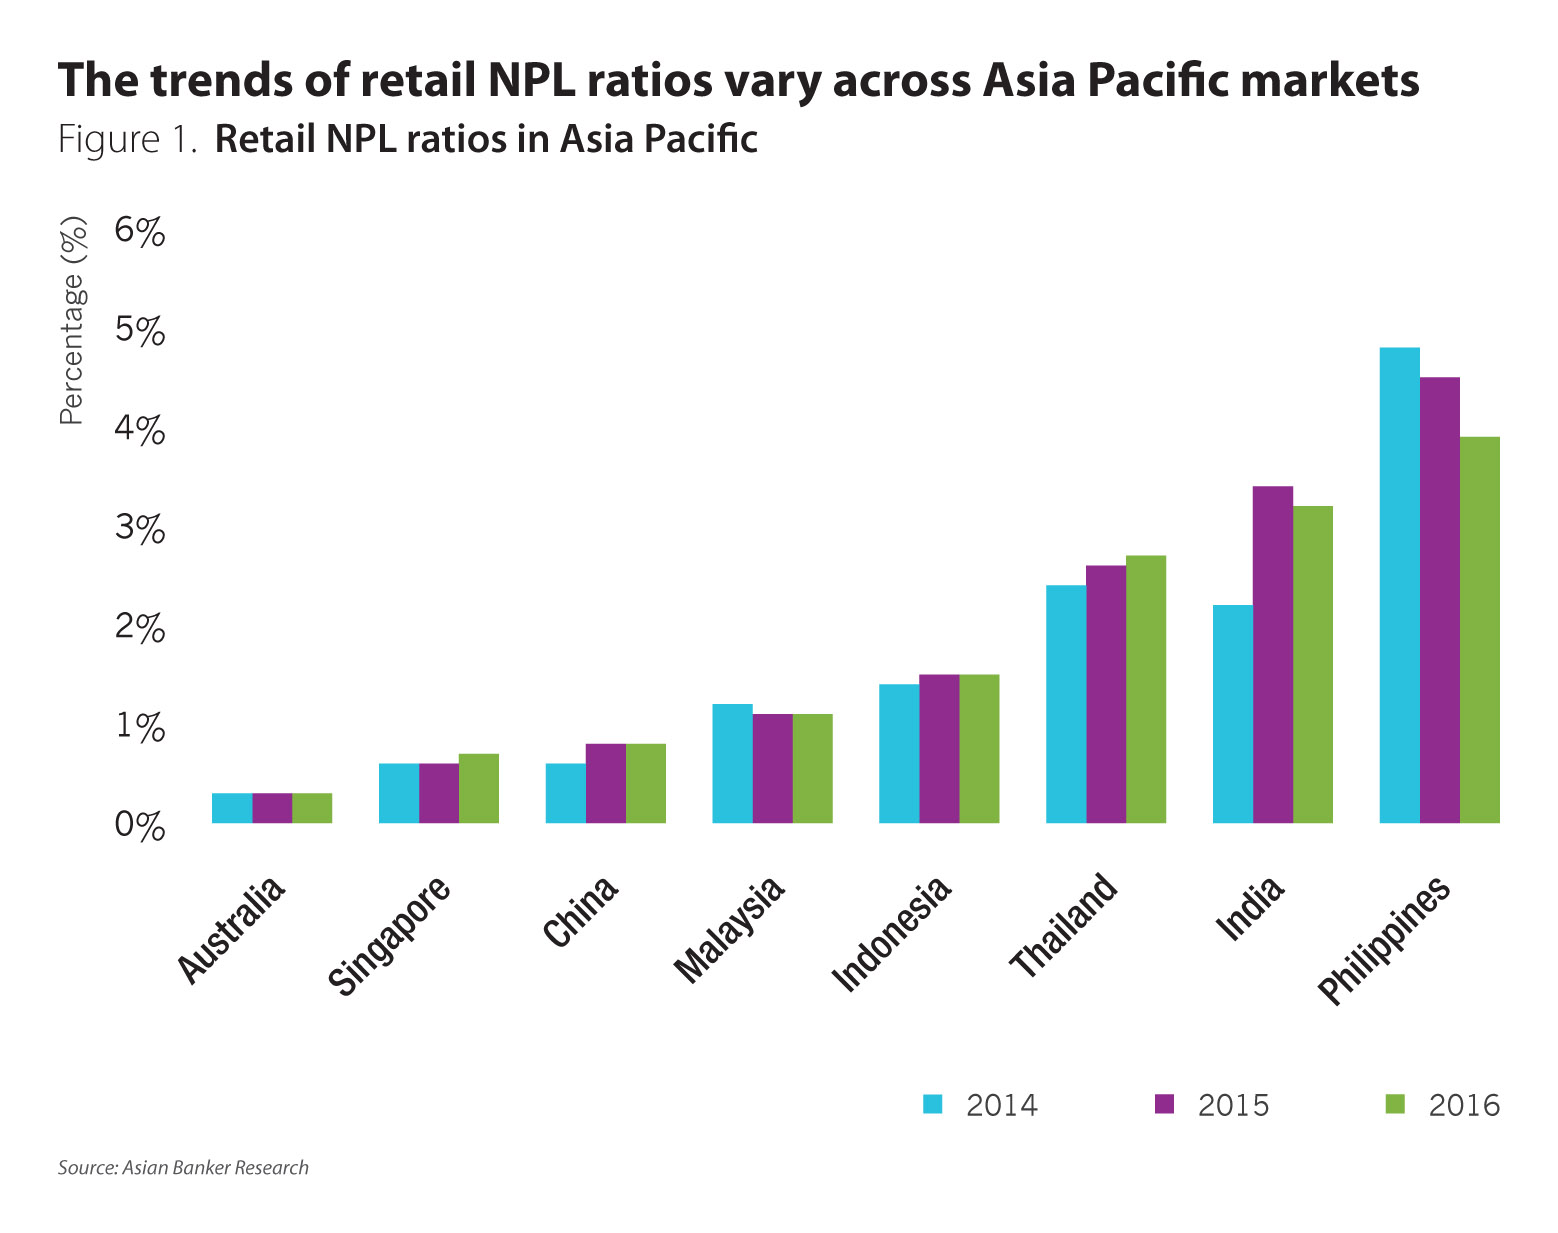
- Retail NPL ratios for banks in Malaysia and the Philippines decreased between 2014 and 2016 unlike in China, Indonesia, Singapore and Thailand
- Overall retail asset quality is expected to be manageable, partially owing to improving macroeconomic conditions in the region
Economic conditions remain challenging in Asia Pacific (APAC). Banks across the region continue to face tough operating environment, and most banks’ retail asset quality remains under pressure. Nevertheless, we expect the overall retail asset quality to be manageable. There are some signs of improving macroeconomic conditions, especially in Southeast countries, which suggest a slowdown in new non-performing loan (NPL) formation.
The trends of retail NPL ratios, which exclude NPLs from small and medium-sized enterprise (SME) banking, vary across APAC markets, partially owing to their relative positions in the credit cycle (Figure 1). Between 2014 and 2016, banks in Malaysia and the Philippines have seen a decrease in their retail NPL ratios,while the retail NPL ratios for banks in China, India, Indonesia, Singapore and Thailand showed an upward trend. Australia, Singapore and China maintain retail NPL ratios of less than 1%, while the retail NPL ratios of banks in the Philippines, India and Indonesia are much higher.
However, it is important to note the differences in the way these markets classify loans as NPLs. For example, China has its own unique way to recognise NPLs. The reported retail NPL ratio of Chinese banks remains low compared with their peers in the region, when the actual retail asset quality of Chinese banks is believed to be worse. The higher retail NPL ratios was mainly due to slower economic growth and worsen employment situations.
Meanwhile, the pace of retail lending growth decelerated in most countries after years of remarkably high retail loan expansion following the financial crisis. This was largely owing to subdued economic growth, weak consumer sentiment, stricter loan standards and tightened measures launched by central banks to address the problem of excessive household debt.
China’s banking sector continued to record strong retail loan growth to support the target growth rate, which was one of the reasons why the reported retail NPL ratio of Chinese banks didn’t rise that much. They are also facing increasingly higher potential risks. Retail credit growth in India also remains strong, which is likely to weaken Indian banks’ retail asset quality in the future.
Furthermore, the retail asset compositions in the countries affect the NPL ratio of the industry as the NPL ratio for unsecured retail loans is generally higher than the ratio for secured retail loans. For example, in the Philippines, the NPL ratio for secured loans was 3.4% in the first quarter of 2017, lower than 5.5% for unsecured loans.
Thailand is an exception. Thai banks’ mortgage NPL ratio was higher than the NPL ratios for credit card loans and personal loans. During the past few years, the NPL ratios for unsecured retail loans weakened at a faster pace than secured retail loans in countries like China and Malaysia. However, the downside risks to banks’ asset quality remained limited, as unsecured retail loans account for a relatively small proportion of total lending.
China
The stated retail NPL ratio of China’s banking system went up from 0.5% in 2013 to 0.8% in 2015, as China’s economic growth slowed down (Figure 2). The credit card loans’ NPL ratio weakened from 1.11% in 2012 to 1.84% in 2015. The NPL ratio of mortgage loans, which made up around 70% of total retail loans, has been relatively stable between 2011 and 2014. In 2015, mortgage NPL ratio rose slightly from 0.29% to 0.39%. The NPL ratio of auto loans has been above 2% since 2012, but auto loans only accounted for 1% of total retail lending.
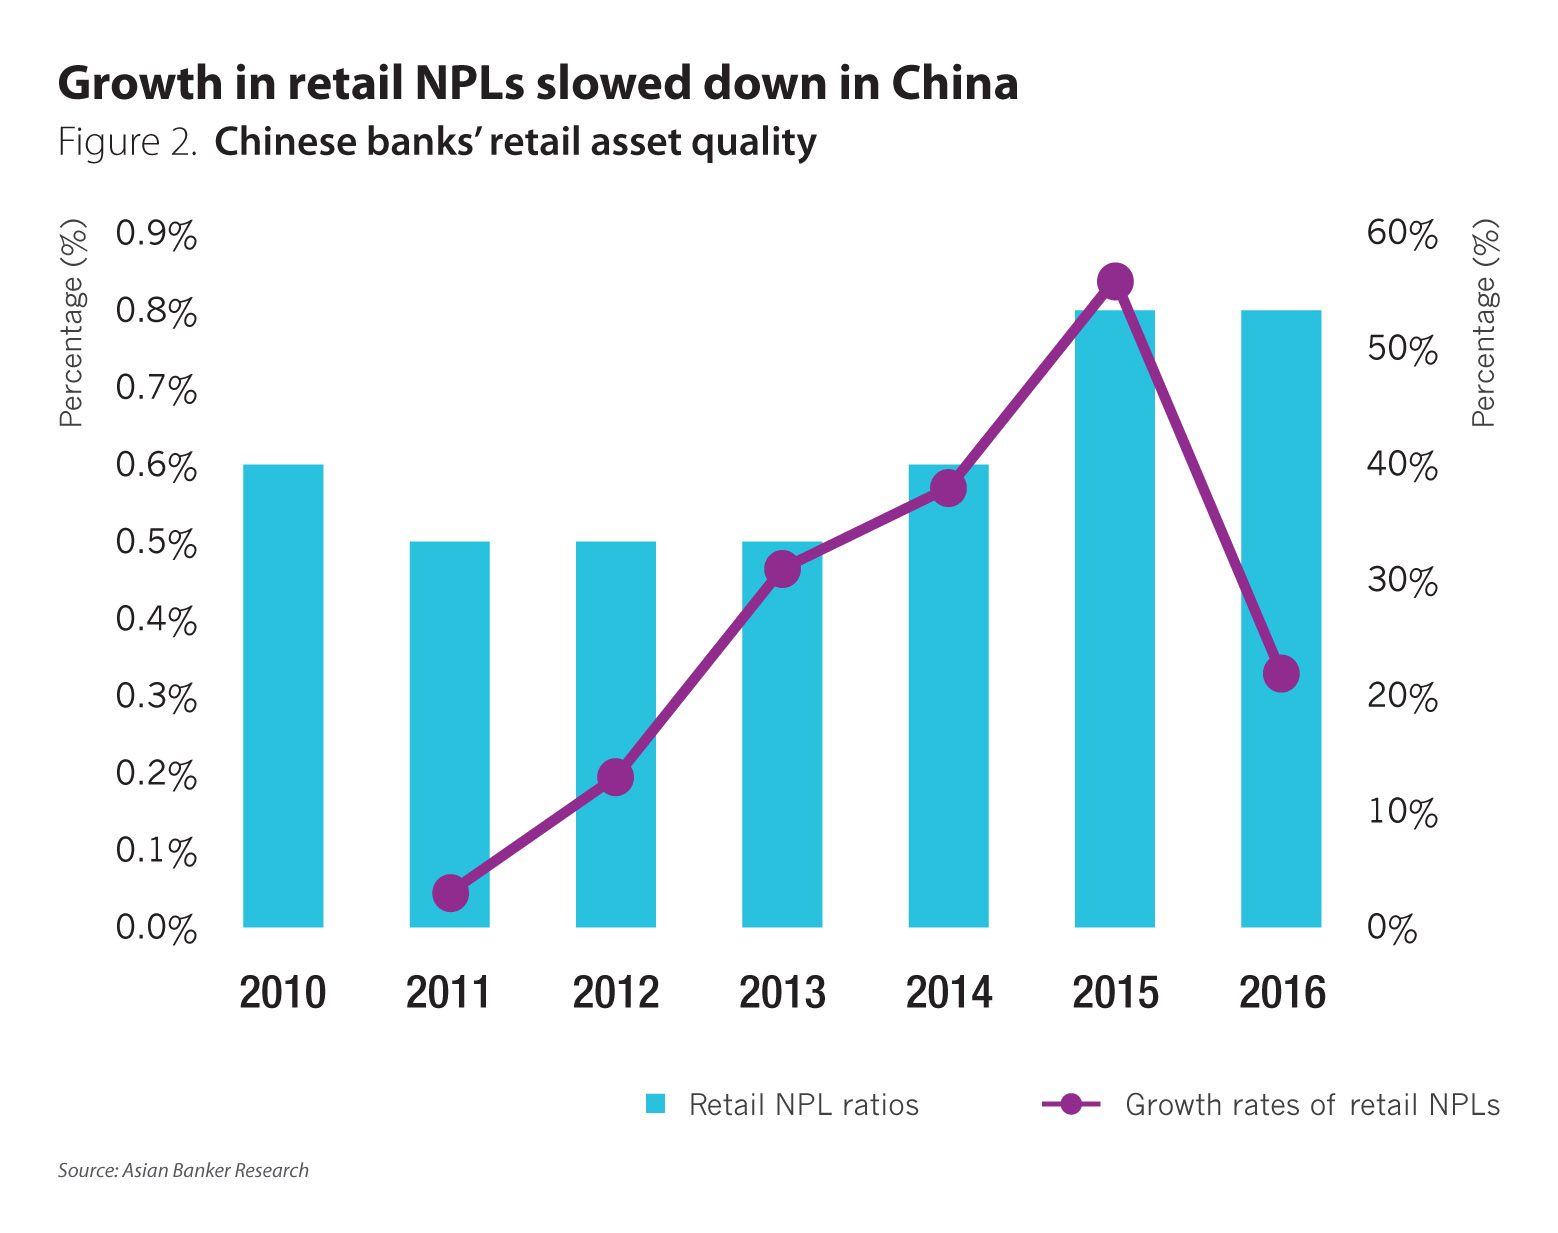
In 2016, Chinese banks’ retail NPL ratio held relatively steady and growth in retail NPLs moderated, mainly due to strong retail loan growth and the acceleration of bad debt write-offs and transfers to third-party asset managers. In addition, six large Chinese banks were permitted to issue asset-backed securities products with bad loans as underlying assets in early 2016, which also helps them deal with surging bad debt.
Although retail asset quality of Chinese banks will remain under tremendous pressure, Chinese banks are not expected to report any significant deterioration in their retail asset quality in 2017, due to stepped-up efforts by banking regulators and banks to tackle the debt burden. Some mid-sized banks will also be allowed to issue bad loan-backed securities in 2017. Meanwhile, tighter regulations on mortgage loans will help banks control credit risks.
Malaysia
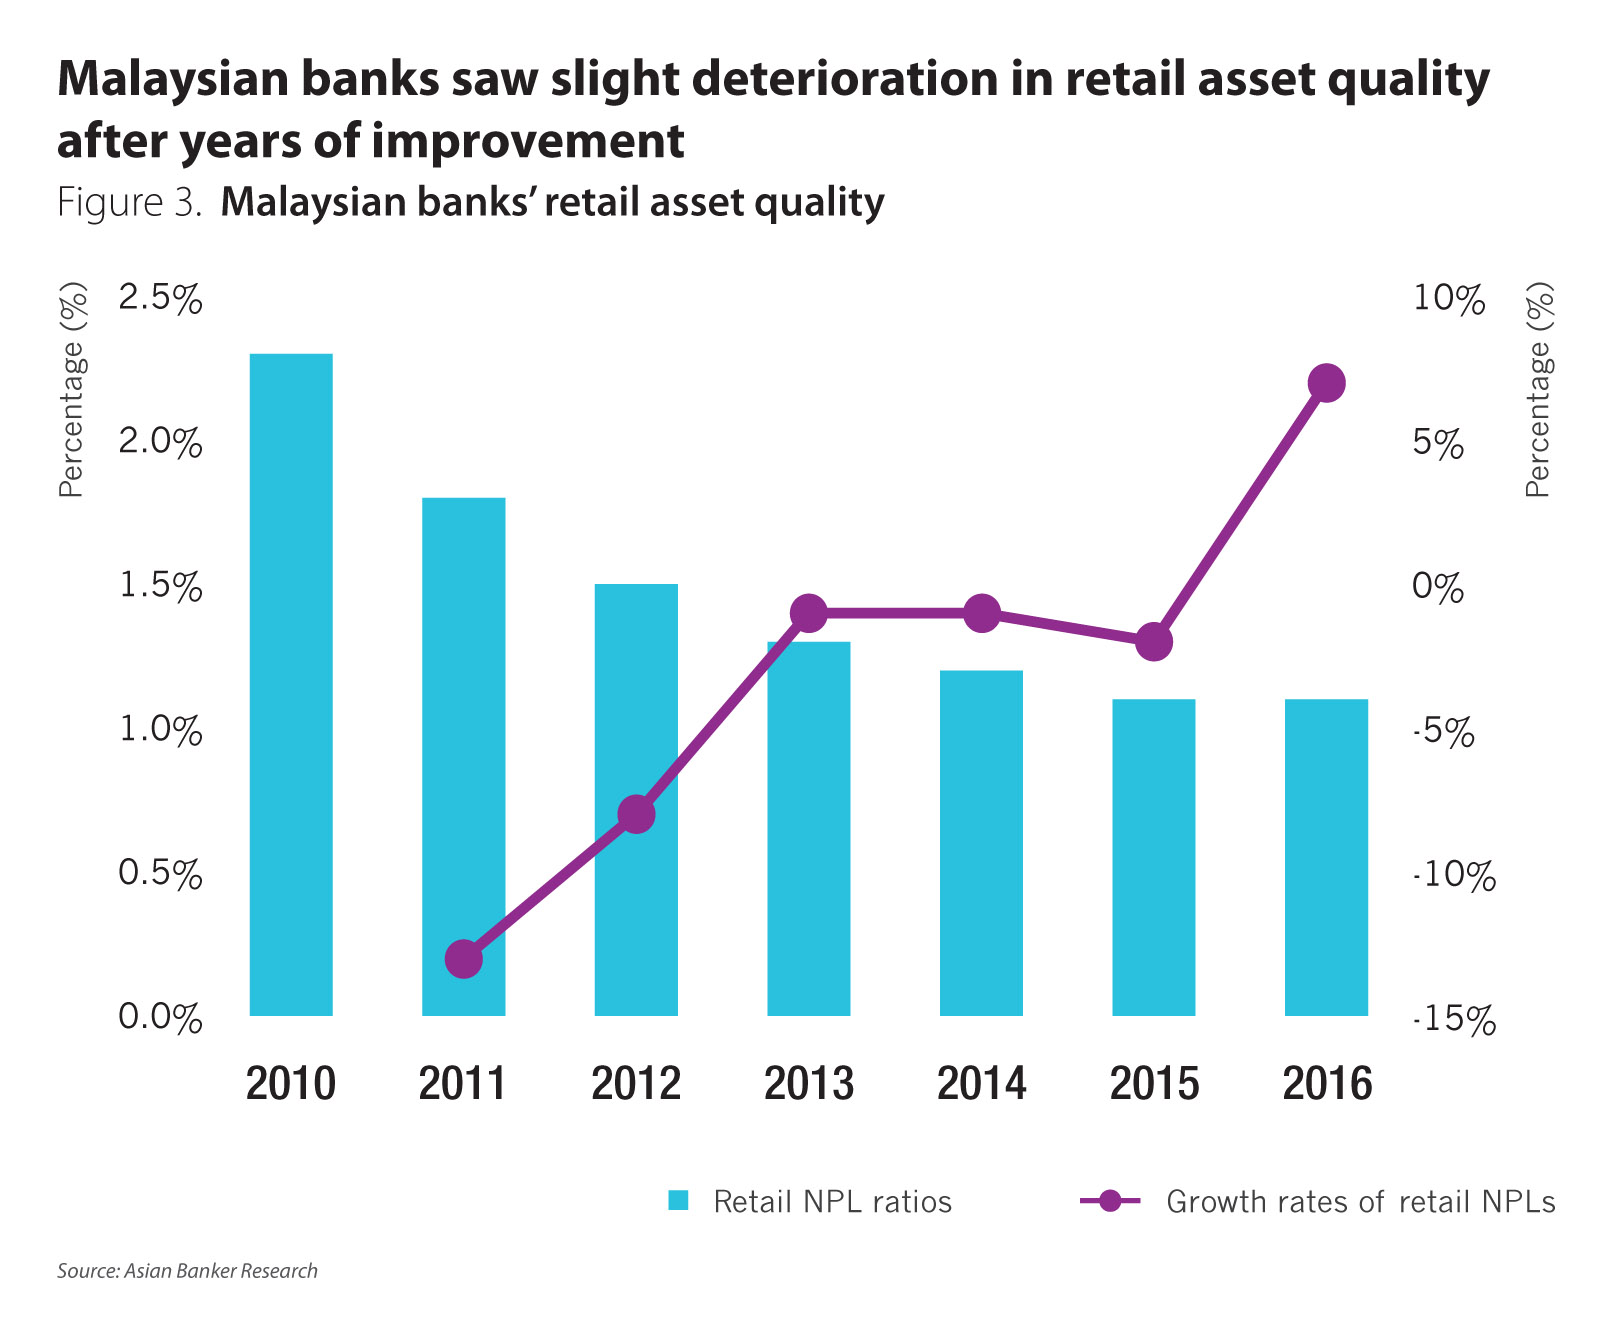
Retail NPL ratio of Malaysia’s banking system eased gradually from 2.3% in 2010 to 1.1% in 2015, reflecting great improvements in retail asset quality (Figure 3). The absolute value of retail NPLs of Malaysian banks had also reduced. In 2016, Malaysian banks saw their retail NPL ratio inch up to 1.07% from 1.06% in the year before. Retail NPLs went up by 7%, while retail loan growth moderated to 5.3% from 8% in the previous year.
Further weakening in retail asset quality is expected in 2017 amid higher cost of living. However, retail asset quality will remain relatively sound. Leading loan indicators such as loan applications and approvals remain weak, which suggests that retail lending activity will remain tepid in 2017.
Between 2010 and 2016, the NPL ratio of mortgage loans improved the most, with the ratio declining from 3.2% to 1.1%. In 2016, the NPL ratio of secured loans continued to decline, while the NPL ratio for unsecured loans rose. The quality of credit card loans is the worse among all the categories of retail loans.
Philippines
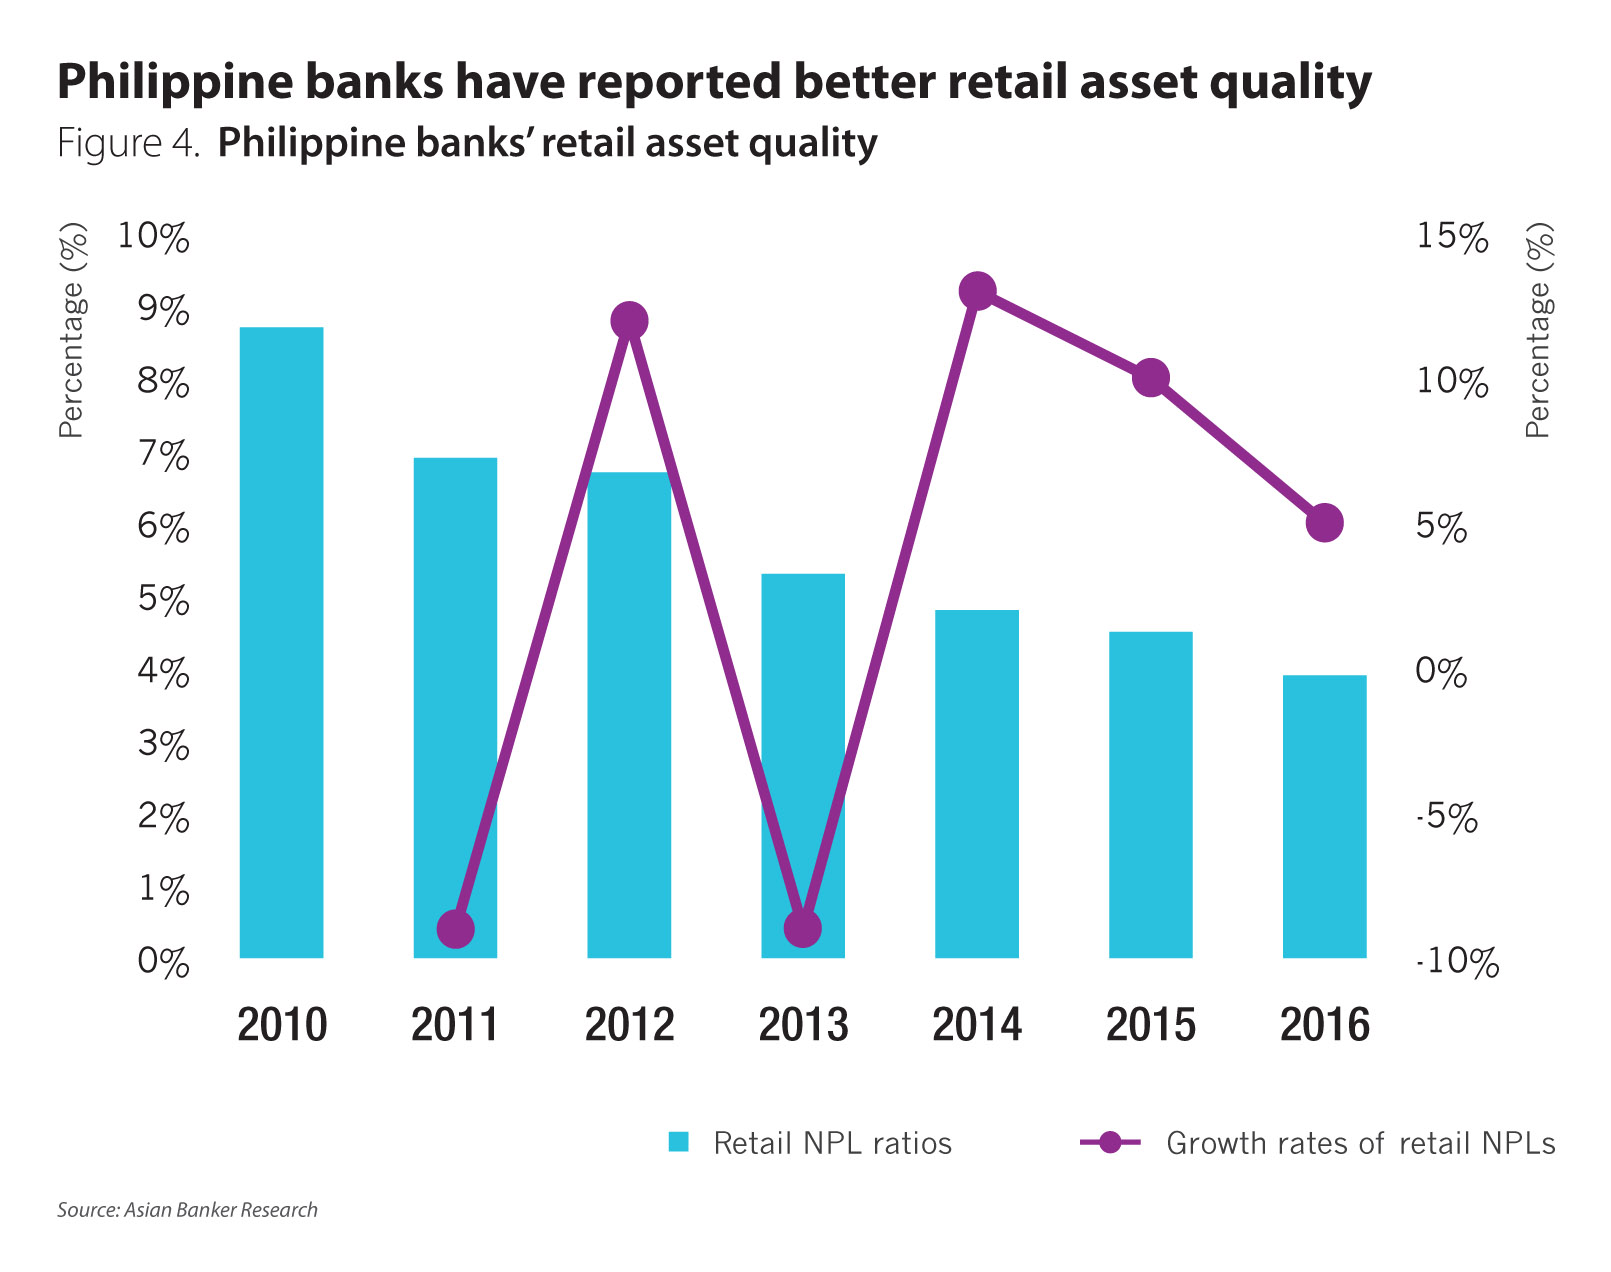
During the past few years, retail asset quality of Philippine banks has improved substantially amid the favourable economic conditions. Gross retail NPL ratio for the banks has fallen to 3.9% in 2016 from 8.9% in 2010 (Figure 4). The quality of credit card loans and unsecured personal loans has showed the greatest improvement. The NPL ratios of credit card loans declined from 12.4% in 2010 to 5.9% in 2016. The NPL ratio of motor vehicle loans, which accounted for 30.5% of total retail loans in 2016, only dropped slightly. The mortgage NPL ratio stood at 2.8% in 2016, the lowest among all the categories of retail loans.
The Philippine banking system reported higher NPL ratios for retail loans than for corporate loans. Thrift banks have a higher exposure to consumer loans, which has a higher probability of default, while larger universal and commercial banks are better positioned to weather economic shocks and market volatility. The gross retail NPL ratio of universal and commercial banks stood at 3.7% in 2016, as compared to 4.3% among thrift banks.
In 2017, Philippine banks are expected to sustain retail loan growth and also maintain relatively stable retail asset quality, backed by the broadly steady operating environment and prudent monitoring by the Bangko Sentral ng Philipinas.
Singapore
The retail NPL ratio of Singapore banks has shown an upward trend since 2012, although their retail asset quality still remains sound. Singapore banks’ retail NPL ratio weakened from 0.5% in 2012 to 0.7% in 2016 (Figure 5), mainly contributed by mortgage loans.
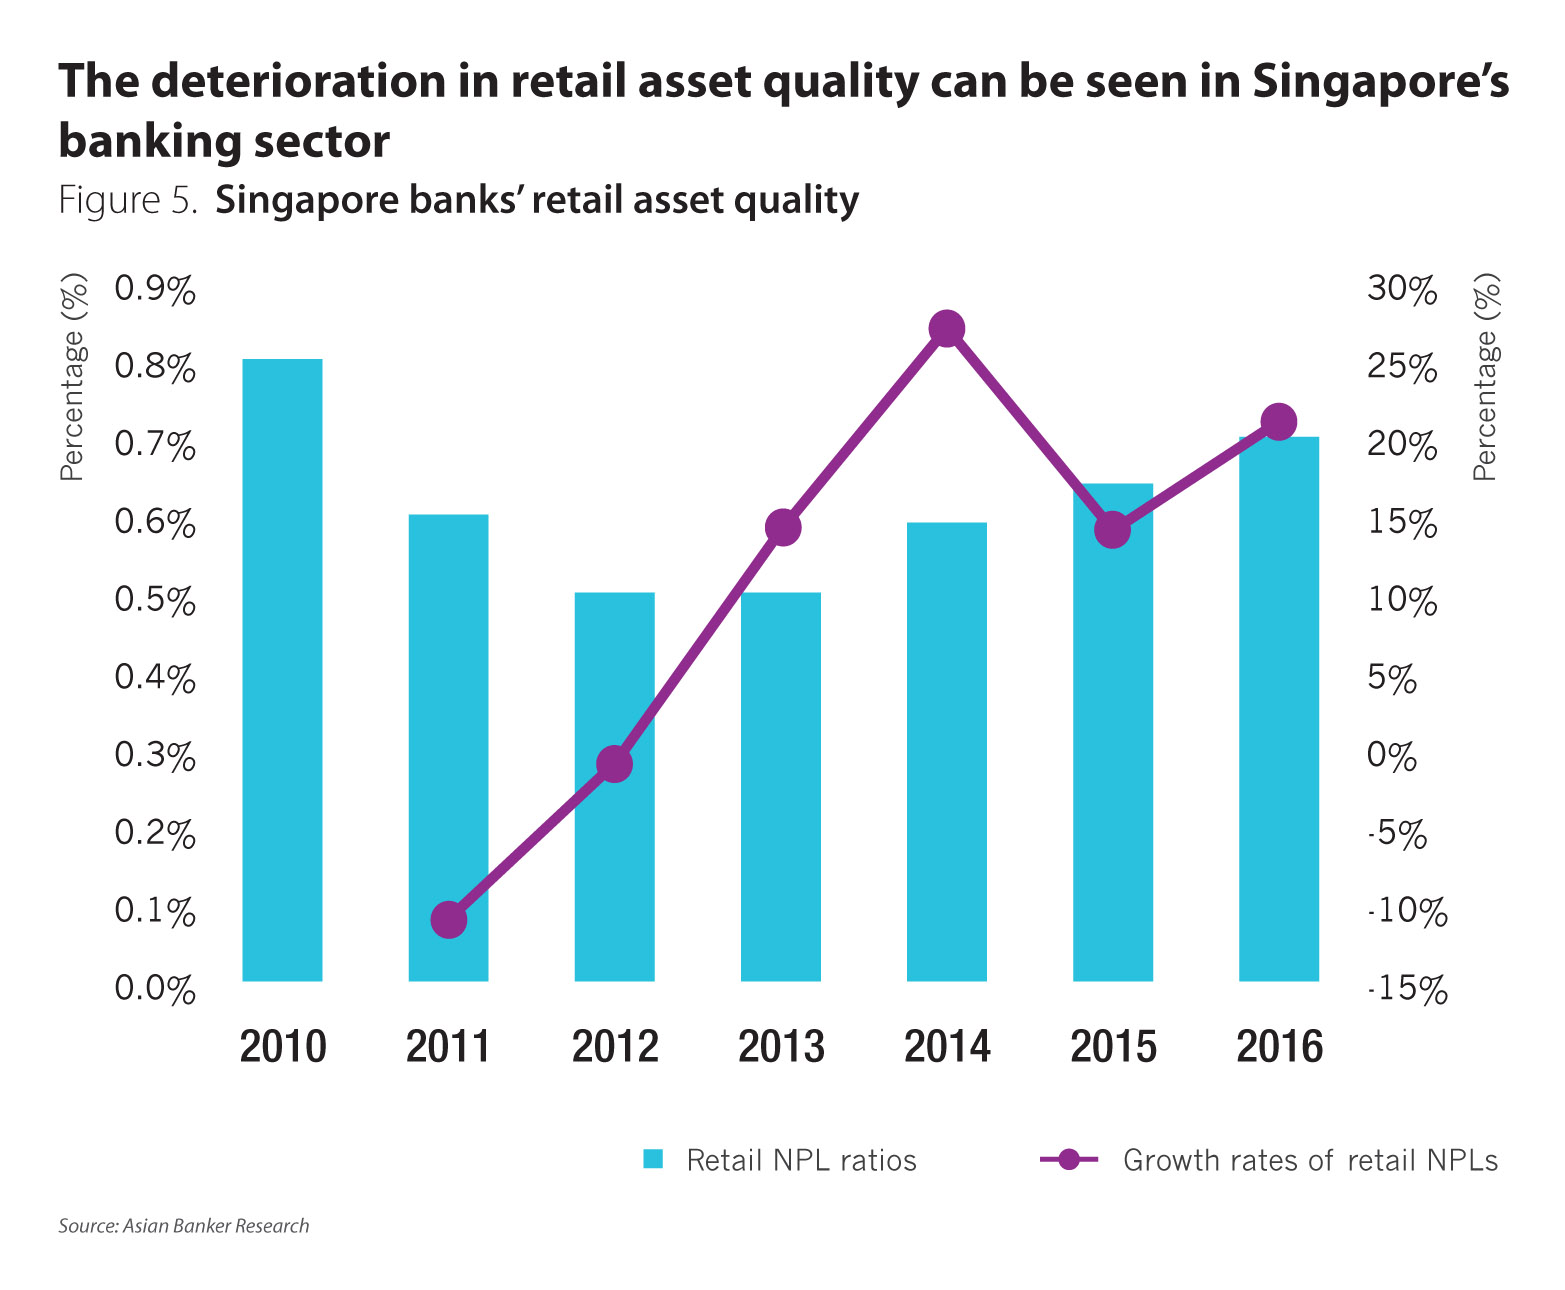
The mortgage loans made for around 70% of total retail loans, and mortgage NPL ratio declined from 0.4% in 2012 to 0.6% in 2016. The growth of retail loans dropped from 18.5% in 2012 to around 3% in 2016, mainly due to macroprudential policy measures implemented over the past few years. We expect the retail loan growth to remain subdued in 2017, while retail asset quality of Singapore’s banking sector will deteriorate further.
Thailand
Retail asset quality of Thailand banking sector continued to weaken over the past few years, with retail NPL ratio climbing from 1.9% in 2012 to 2.7% in 2016 (Figure 6). The deceleration of retail loan growth is partly attributable to the rising retail NPL ratio. Retail loans expanded at a compound annual growth rate (CAGR) of 6% between 2013 and 2016, much slower than 17% between 2010.
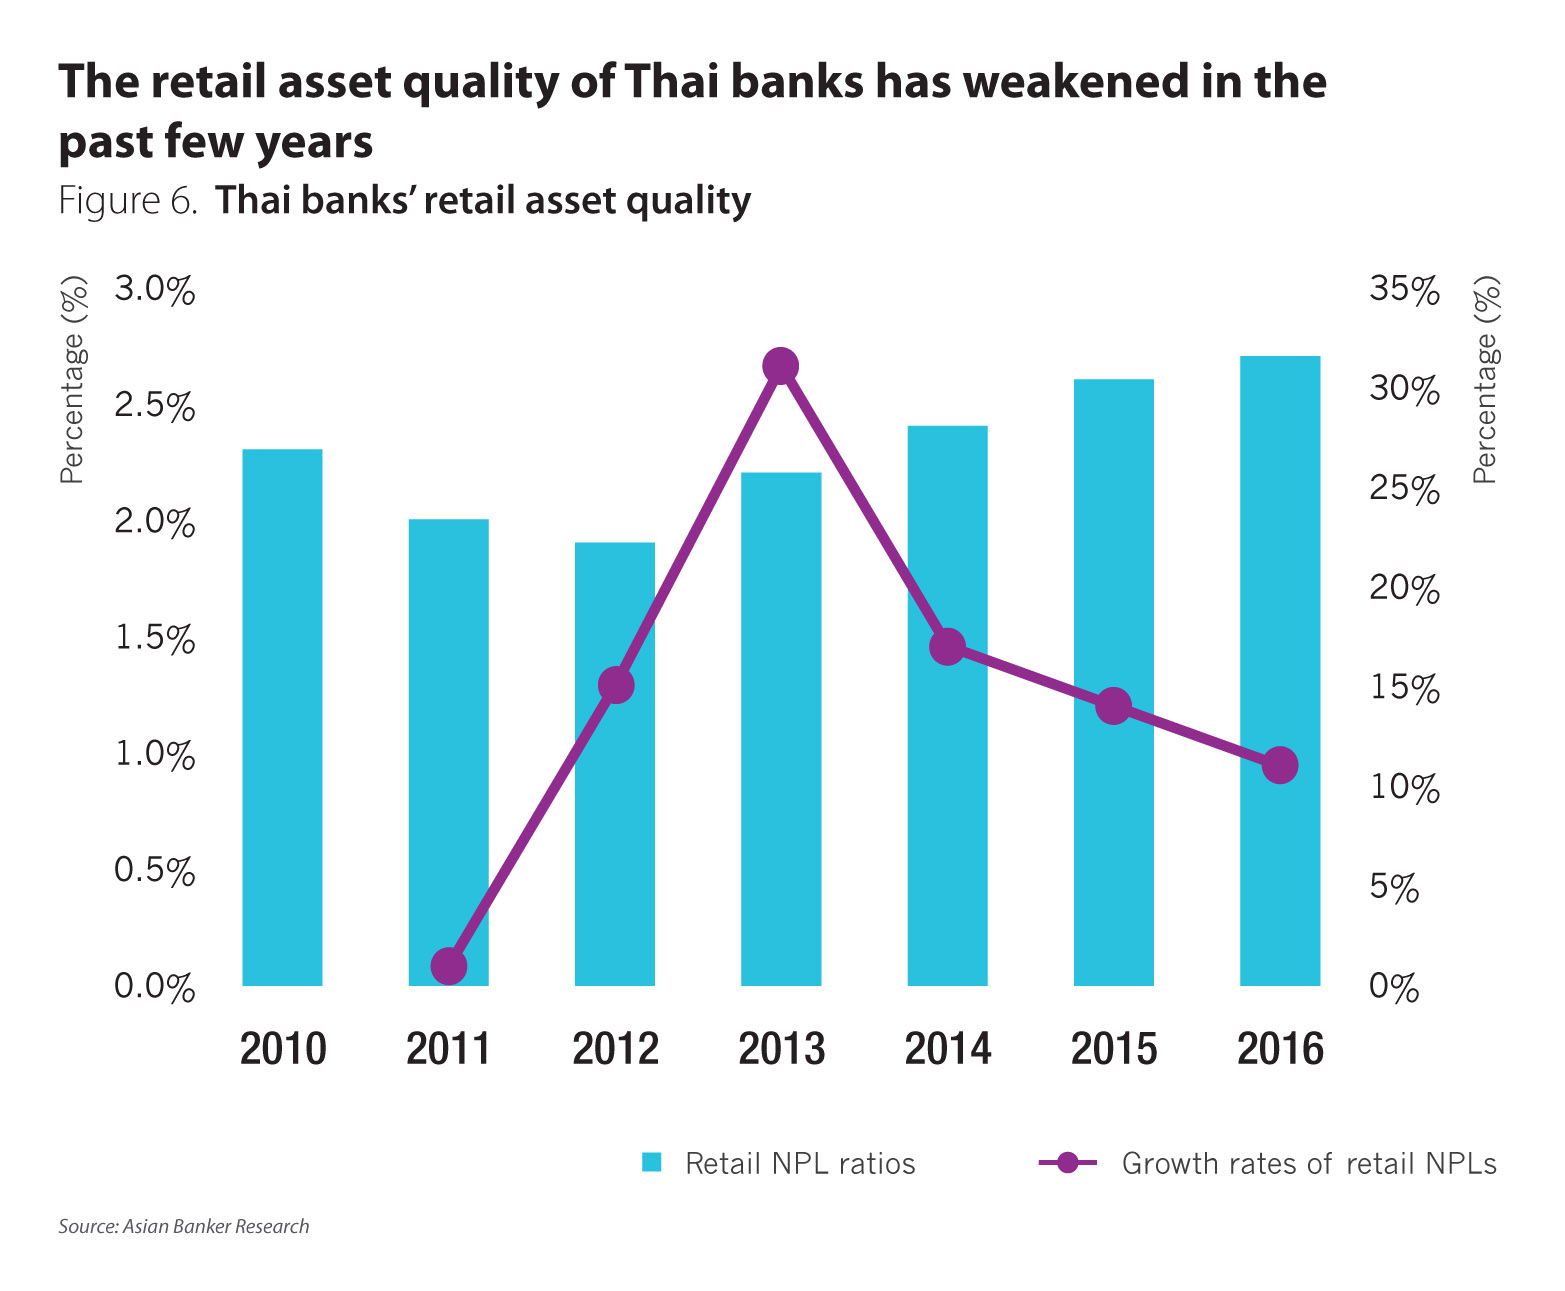
The NPL ratio for credit card loans is the highest among all categories of retail loans. The biggest drivers are mortgages and credit card loans. In the first quarter of 2017, the NPL ratio for housing loans and credit card loans stood at 3.2% and 4.1%, respectively, compared with 2.3% and 2.0% in 2012. Retail NPLs have continued to expand at a slower pace.
Special mention retail loan ratio was down to 3.19% in 2016 from 3.27% in the previous year. We expect to see some signs of stabilisation in retail asset quality in the near future, as mild economic recovery is expected.
Going forward, retail asset quality pressure will persist in the Asia Pacific region. However, the downside risk to banks’ retail asset quality will remain manageable, especially when there are signs of gentle economic recovery in some countries. The banking regulators and banks will continue their efforts to better manage banks’ credit risk.
Categories:
Data & Analytics, Datafile, Industry Developments, Retail BankingKeywords:Retail Asset Quality, APAC, NPL